Back to insights

Introducing Google Page Experience Update

Audio article-

How to make sense of web speed metrics, accurately measure your site’s performance and the impact it has on your bottom line.

If you own or manage a website, you’d have to be living blissfully under a pretty large rock to miss all the buzz about the rising importance of website speed. The announced Google Search algorithm update has the whole industry in a reluctant frenzy, with developers, agencies, and SEOs scrambling to figure out just what the new requirements will be, how their websites may be affected, and what they can do to prepare for the imminent future.

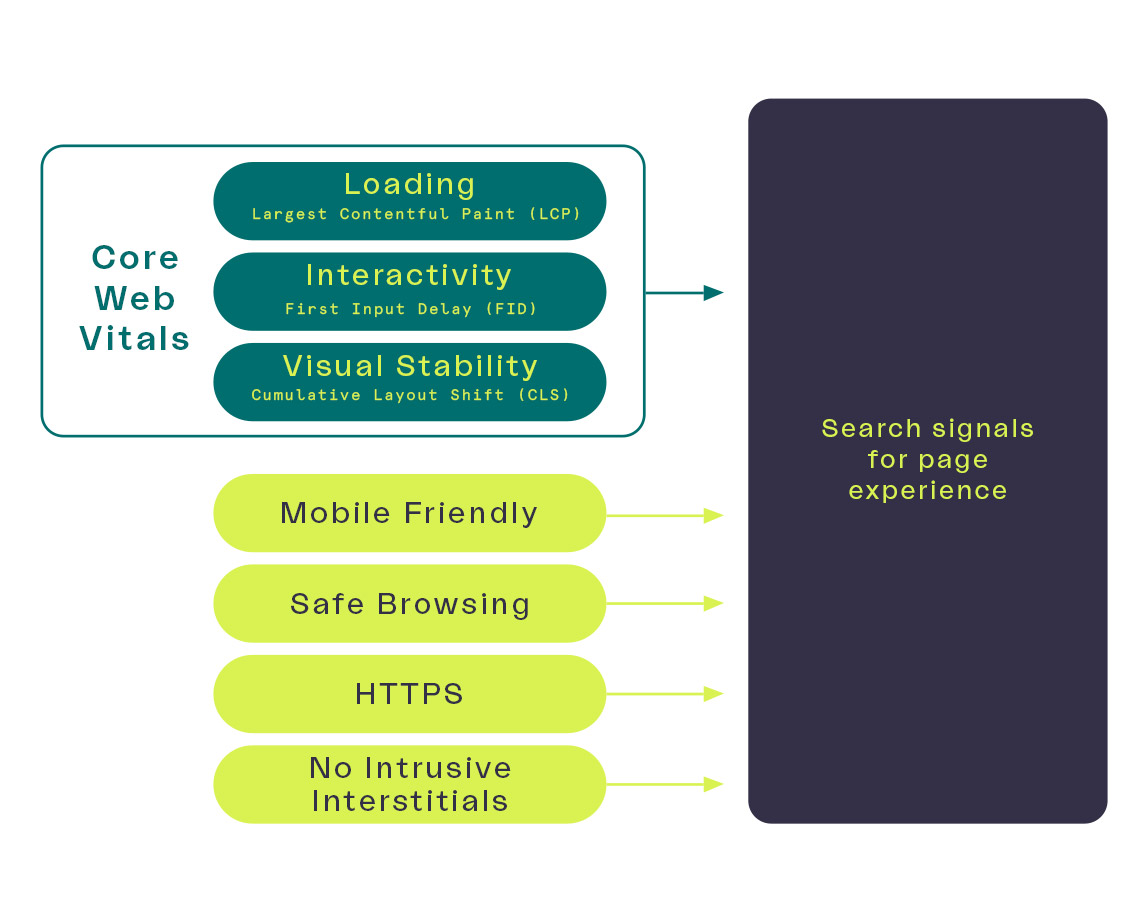
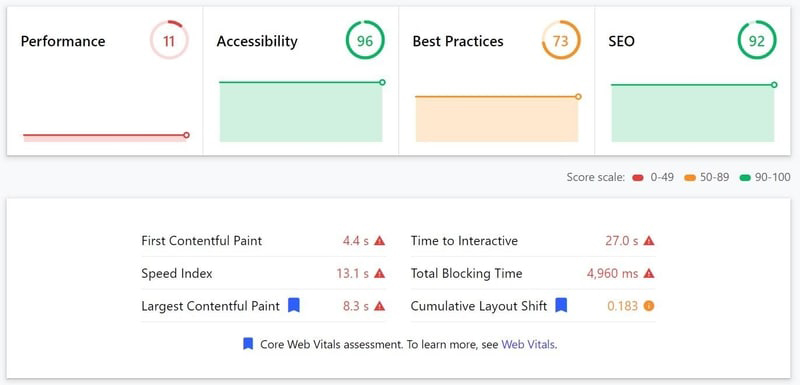
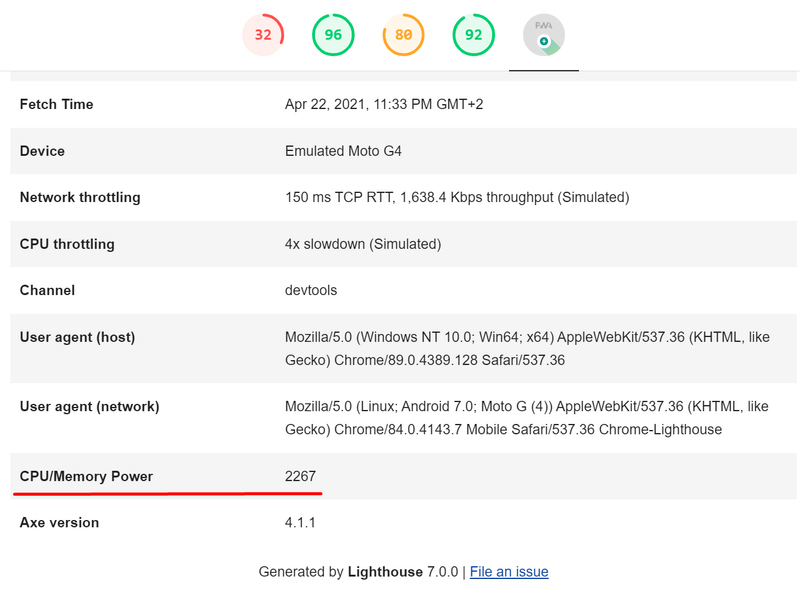
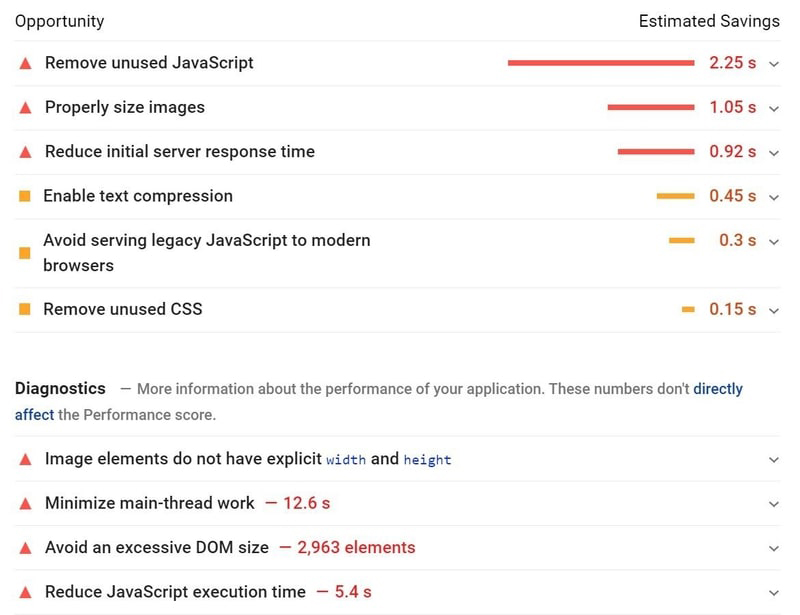
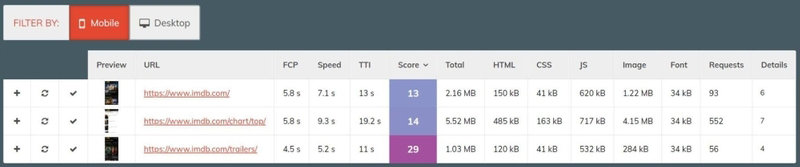
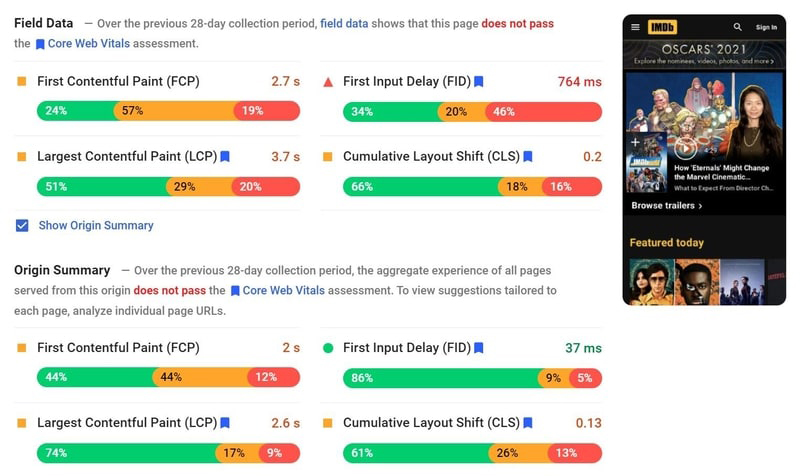
This article will cover the latest news about the Google “Page Experience” search algorithm update (with Core Web Vitals), advice on using tools like Lighthouse and PageSpeed Insights, and a showcase of our approach for reliable and insightful website performance measurement.

We’ve got a lot of ground to cover, so grab yourself a hot beverage and a box of pretzels, and turn off notifications for about 40 minutes of casual reading.

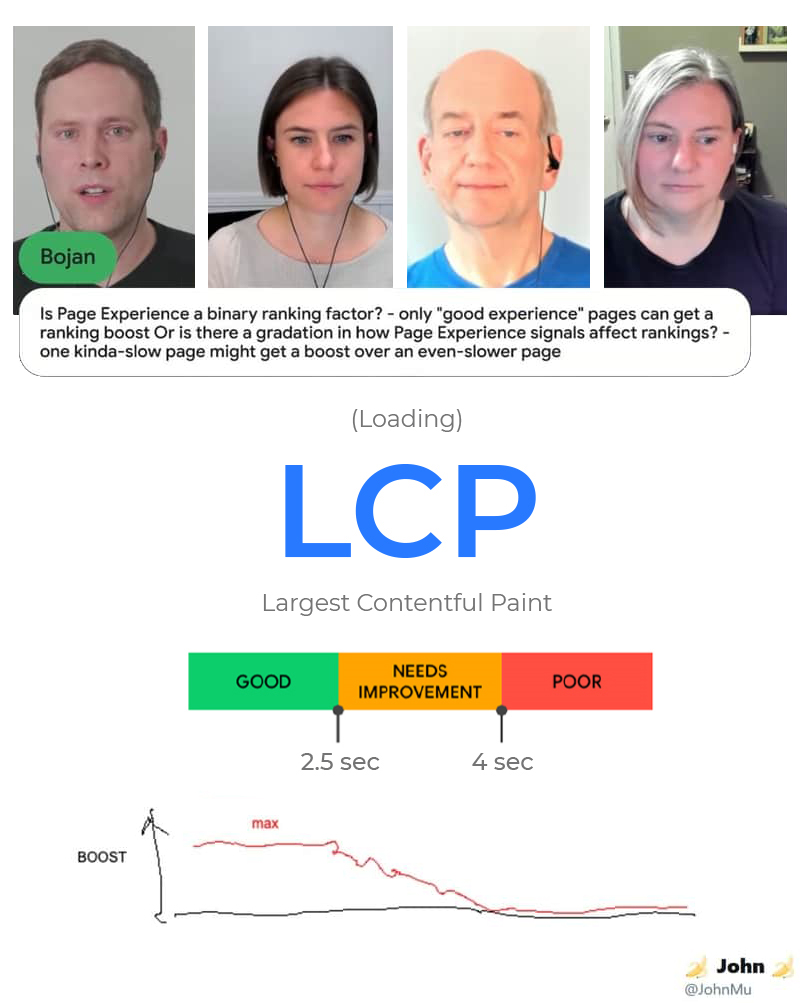
As it often happens with matters of SEO, in which so many people participate since it lies snugly between technology and marketing, there is a lot of chatter, hype, and misinformation circulating about the upcoming Google search update that will give a ranking boost to faster web pages. Getting clear understanding and straight answers is an arduous task, so it’s worth taking a step back to glance at the big picture.

Why is website speed important?

The speed at which web pages load and how smoothly they perform has an immediate impact on just one thing: User experience.

The connection between page loading speed and user behavior is obvious and well-documented in various studies. While those can be useful for a quick reference in your slides, to illustrate the importance of website speed, it might be a double-edged sword as some of the claims may seem unrealistic, overblown, or not relevant for your business.

Like the massively referenced Google’s study that “53% of people will leave a mobile page if it takes longer than 3 seconds to load” (which now conveniently returns a 404 error).
A much stronger argument would be to correlate your page loading speed with your conversions from your own data – by capturing the loading speed of real people visiting your site. We’ll show you how to set that up near the end of this article.


page performance

Our custom Lighthouse tracking dashboard


In any case, it shouldn’t take more than your personal experience and common sense to expect that – if a web page takes too long to load, an impatient user will likely “bounce” back and not visit that page again. Or, if a page is very slow in responding to user input, people might abandon their online shopping carts or stop engaging with your content. Moreover, a bad user experience may not only cause just a momentary loss of conversions or engagement but can often lead to a lasting negative brand perception.

That’s what is really at stake when we talk about website speed – UX, conversions, and brand reputation. Everything else is just a consequence of that fact.

But, hold on, some of those consequences you really need to know about!

For starters, mobile page speed has an impact on your Google Ads efficiency since early 2019. Your website speed is a part of the Landing Page Experience which in turn affects the Quality Score (QS). If you have a bad QS, your cost-per-click can be significantly higher, your ads may rank lower than your competitors, or it might even make your ads ineligible for appearing in Google Search for your target keywords. Here’s all that excellently explained by an ex-Googler.

SEO metrics

Google Ads Quality Score


Another thing to consider is Equality of Access.

If your main audience is people in the US metropolitan areas, browsing the web on the latest iPhone and a 5G connection, it’s probably fine that your wonderfully designed and content-rich product page weighs several megabytes. However, for someone accessing the same page from a rural area with poor internet access and an old device, they could be waiting half a minute or more for the content to fully load, if it ever displays correctly at all.

Not to mention that viewing large pages has an actual cost for many people browsing the web on a metered connection. So, the push towards a faster website also makes you serve your users more equally, wherever they might be in the world.

world map

World map internet-connected devices by @achillean


And then there’s Google organic search and SEO.

You are, unfortunately, very likely to find many articles (even from otherwise reputable sources, which we won’t link-shame) that would have you believe that speed is about to become the absolute No.1 most important ranking factor for Google. While the simple and provable truth is that page speed has a very low impact on organic search rankings, and that’s not about to change overnight.

Google first started using page speed as a ranking signal back in 2010. No further information was given about how much loading speed influences rankings and in what situations it will matter the most, except that it was only counted for desktop searches.

At the start of 2018, Google released the “Speed update”, bringing that ranking signal to the mobile search algorithm as well. This time they provided a bit more clarity, stating that the update “will only affect pages that deliver the slowest experience to users and will only affect a small percentage of queries”. And sure enough, many respectable and independent studies (MOZ, Sam Underwood) showed that there was (at the moment) no observable correlation between page loading speed and Google rankings.

graph median page load time

MOZ study found no correlation between loading speed and ranking position

The 2021 “Page Experience” Google algorithm update

In May 2020, Google has announced that a new set of seven page-quality factors named Page Experience will become ranking signals. In a second post, they even confirmed the expected roll-out timing and gave us a bit more information.

The biggest news is the introduction of Core Web Vitals to the already existing page experience signals. The CWV are three metrics for measuring page speed performance that real users have experienced on your website. The following post in April 2021 informs that the update will not start in May, as firstly announced, but will gradually roll out from mid-June until the end of August 2021.

core web vitals mockup

Quick facts: what we know about the update so far

  • Page Experience ranking signals will apply to mobile search only – which is in line with Google’s shift towards mobile-first indexing, which by now is probably mobile-only for the vast majority of websites. ‍
  • Update 2021: Google’s @jeffjose announced that Page Experience update will eventually also come to desktop search. Watch the full Google I/O video about the Page Experience update.
  • The Core Web Vitals (CWV) are collected by the CrUX Report (Chrome User Experience). Meaning that they are capturing your website performance only from users on the Chrome browser, and only if the user didn’t opt-out.
    This might seem unfair – your website is being judged only through the eyes of Google Chrome users, even if they make a small segment of your total audience. You might have justifiably optimized your site to work best on Safari or Internet Explorer (don’t laugh, many government agencies and corporations throughout the world require IE compatible websites), but now you’d have to focus on getting the passing CWV scores on the Chrome browser.
    It’s still unclear how this update will treat websites that receive almost no traffic from Chrome users, but over the years Google has hinted that they might use some form of synthetic (non-user) speed measurement alongside the real-user data.
  • The CrUX data is aggregated by the past 28 days, so you might have to wait more than a month after your optimization efforts have been completed to see any improvements in the scores.
  • Each of the three Core Web Vitals metrics has two thresholds, dividing any real-user experience on your web page into three buckets: “Good”, “Needs Improvement” and “Poor”.
    ‍But it gets more complicated… your pages are not scored by the average user experience.
    ‍In order to qualify as “Good”, the page must achieve a passing performance on 75% of all visits (pageviews). For example, your landing page needs to achieve a First Contentful Paint in under 2.5 seconds for 75% of the time it’s being viewed. And if your main audience is people with old devices and a weak internet connection, you need to optimize your site drastically in order to achieve a passing CWV score. More on how to read CWV scores a bit later.
page performance graph

Pages in Core Web Vitals buckets – Google Search Console


  • All of the Page Experience metrics, including CWV, are pass or fail, and passing scores are equalized.

    If two (equal quality) pages are both “in the green” by CVW metrics, you won’t get any additional ranking advantage by making your page even faster than the competition. So, there’s no point in over-optimizing if you already achieved a passing score.

    However, if two (equal quality) pages both fail the CWV assessment, the faster one might get a ranking boost. This seems to contradict the next statement so I’ll try to get some clarification from Google.

    [Update 2021-05-19] During the Google I/O AMA on Core Web Vitals, the Google team answered my question and clarified that even if a page fails the CWV assessment and isn’t graded as “good” it still may receive a ranking boost if it has better performance than the competition.

    In other words, the Page Experience signals are not binary (only for “good” pages), but are granular in their effect on rankings, so it can be worth improving your CWV scores even if you don’t manage to get them “in the green”.
google page experience conference call

My question at Google I/O and the doodle form John Mueller as the answer


  • For example, a minimalistically spartan website https://vulfpeck.com/ doesn’t pass the CWV assessment, despite achieving a super-high mobile Lighthouse score.
    I mean, how much more funkier can it even get?
vulfpeck page metrics

This site fails the CWV assessment only because of the low FID score, despite all other metrics being stellar


  • Mercifully, Google has already stated multiple times that this update will not create a sudden jolt in the search results. The expected impact of this update will be small at first, and gradually more noticeable as the dust settles.
  • Just like with similar secondary ranking signals (and expected from the patent documentation), the Core Web Vitals will have the most impact on ranking in “tie-breaker” situations where multiple pages of very similar content and overall quality are competing for the same keyword. In those scenarios, a page that loads faster and has a better user experience might get a ranking boost over similar but slower competing pages.
  • Again, these secondary signals would not jeopardize the most important aspect of Google Search: “Our systems will continue to prioritize pages with the best information overall, even if some aspects of page experience are subpar. A good page experience doesn’t override having great, relevant content.” – from the Core Web Vitals FAQ.
  • The update will also start something of a decrescendo for the AMP framework that didn’t quite catch on, even after years of Google pushing it on all fronts. This change will make non-AMP pages eligible for appearing in the Top Stories carousel and Google News (no mention of Discover !?). Since we at CMG don’t have clients in the daily news publishing market, we won’t be examining this in detail.
  • Finally, in the November 2020 post, and again in April 2021, Google has teased a possibility of the “Great Page Experience” badge that deserving pages might get on the search results, to reward them for having exemplary user experience. This seems even more likely since Google announced the removal of the AMP badge.

While the last point could look like a nice way for Google to reward the effort and expense that website developers and owners put into making their pages pass all those ambitious requirements – it might actually do more harm than good.

We already have the Lighthouse score, which is basically a vanity metric. But, at least it’s technical enough that most website owners aren’t aware or overly concerned about it. You have to intentionally run the PSI or Lighthouse test to see it. And only at that point does the trouble start for us agencies/developers/SEOs… more on that later.

How Google search results might look with a new Good Exeprience badge is presented on the image below.
Although, I’m sure they’ll do something a bit more imaginative.

google search results what is AMP

However, if Google puts “Good Experience” badges on the search results page, everyone and their CMOs will be able to see it, or lack thereof.

And if website owners don’t see a badge next to their pages, they’ll demand immediate attention from their web team to get the badge ASAP. Regardless of the question if users actually care or even notice the new badge, or if there are more pressing matters to improve on the website.

So, we’re kind of hoping that Google doesn’t roll out the badge of excellence, but we’re making preparations as if it will surely happen.

Regardless of the badge, this Google update shouldn’t have a dramatic effect on anyone’s website, at least not immediately.

We’ll closely monitor all of the sites we manage as the update gradually rolls out and capture the changes in organic rankings, then correlate those changes with website speed performance and the Core Web Vitals. It will be interesting to see how much, if at all, things start to shift in the various markets and verticals that we cover.

How to measure website speed

There is a common misconception, popularized by the Lighthouse score, that a web page’s performance can be expressed as a single number. Unfortunately, things are not that simple.

I mean, answer me this: What is the fastest car in the world?
Well, the SSC Tuatara currently has the highest top speed in a straight line, the Lamborghini Aventador SVJ holds the record lap time on the Nürburgring, while the Porsche 918 Spyder apparently had the quickest recorded 0-60 mph acceleration time.

But, which of them is “the best car”?
For a family of four, doing their weekly shopping, none of those amazing supercars would be usable. (the dad disagrees)

I won’t stretch this metaphor any further, so I’ll conclude that as for cars, it is also true for websites that – there is no one single metric for speed. It has to be measured by several metrics. Which ones should you choose or prioritize really depends on what is important to you, and your users.

There is a standard sequence of events that happens every time a web page loads in the browser. It goes (very) roughly like this:

1. Your browser asks the DNS to turn the web page URL (http://some.website.com) into an IP address of the server where that page is stored.
2. Then your browser sends an HTTP request to that server,
3. Which responds by sending you an HTML file.
4. Your browser starts to read and render the HTML…
5. While requesting additional linked files it comes across, like images and scripts.
6. The browser starts to paint pixels on your screen, showing the first bit of the web page’s layout and content.
It is continually processing the files it has, while downloading the rest, and you see the page quickly being built before your eyes
7. You can scroll and click on the available elements of the page, but some functionality might not work immediately.
8. All files have been downloaded.
9. All files have been processed.
10. You see the final “render”, a visual representation of the web page, and can fully interact with it

Example of loading page www.weather.com:

page screens

Each one of these steps needs some time to execute, but the final step isn’t necessarily the one users care about the most.

Remember, UX is about experience and human psychology. The perceived speed isn’t the same as actual or measured speed. That’s why we try to optimize for the critical rendering path, and not the total time a webpage takes to completely load.

For content-based web pages, it’s much more important to show some meaningful content quickly, even if it’s not the final design, rather than to show a blank screen until the whole page is downloaded and processed.

On the other hand, for a web app (like Gmail or Netflix), it might be more important to quickly enable user interaction, even before all the content has loaded.

“First Contentful Paint”, “Largest Contentful Paint”, “Total Blocking Time”, “Onload Time”… those metrics are like the “top speed”, “acceleration” and “torque” in our car / webpage metaphor.

And that’s why website speed cannot be represented as a single number. Even though you’ve probably seen it done many times.


PageSpeed Insights

imdb page metrics

PageSpeed Insights = Lighthouse + CWV


Google’s PSI tool is the most popular way for most people to see how fast their (or competitors’) website is. You type in a web page URL, the tool runs through a series of audits and displays a colorful assortment of metrics, topped by the overall PSI score.

Despite what we just established about speed not being a single score, for the sake of convenience and usability for the majority of non-technical folks, the tested page is graded by one number on a scale of 0 to 100.

Given the large and diverse audience of people using the PageSpeed Insights tool, Google’s decision of showing a single score is understandable – convenience trumps the complexities of truth any day of the week. However, this often creates false expectations that are hard to overcome afterward.

Let’s quickly break down what we see in the PSI report, as it can be quite confusing for most people.

In the top-left corner, you can choose to see the report for the tested page either by simulating the performance on a desktop or a mobile device (which is shown by default).

Front-n-center is the PSI score, and a color legend explaining that a score below 50 will be in red, and only 90 and above will be in the green. This is in fact, the Lighthouse score.

I’d bet my whole crypto wallet that the vast majority of people using PageSpeed Insights don’t realize that they’re looking at two very different and distinct measurements. Because, after the big Lighthouse score, we see the (Core) Web Vitals metrics, announced only by a small header “Field Data”.

Basically, there are two kinds of website speed measurements.
Field or Real User Measurement (RUM) is data collected from real people visiting your website on their individual devices and unique network conditions.

Lab or Synthetic Measurement is data generated by a non-human (server/bot, or manual test in the browser) visiting your website and trying to estimate how a real user might experience the page’s performance.

So, in the PageSpeed Insights report, we have the one-time Lighthouse score (lab) for the tested URL, then the monthly real-user Web Vitals (field) for that page, and also for the entire website (origin) if that much data is available.
Below that is the continuation and breakdown of the Lighthouse audits – which generate the final score on the top of the report.

The Web Vitals in between the Lighthouse sections are completely unrelated and have no direct influence on the big rounded score up top.
Most importantly, Google will use only the Core Web Vitals as a ranking signal, while the Lighthouse score has no bearing on your organic search performance.

Still confused? I don’t blame you one bit.
So, let’s try to break that down further.

Google Lighthouse

The Lighthouse tool is a complex set of audits that evaluate many factors of a web page’s performance, including speed, accessibility, and basic SEO readiness. It is solely intended for developers who can run the Lighthouse test while building or optimizing websites.

performance metrics

Google Lighthouse test results


The great advantage and usefulness of the Lighthouse tool is that it can be run on any non-public (preview, staging) or password-protected website environments as the developers are working on them, and it can be launched directly from the Chrome browser’s DevTools.

If you don’t have a habit of pressing the F12 key when surfing the web, you can still try out the full Lighthouse test on https://web.dev/measure/ – the Performance score is the same thing as the PageSpeed Insights score.

However, if you’re no stranger to inspecting web pages and running the Lighthouse from your Chrome browser, you should really know this fact: the Lighthouse scores are heavily influenced by the device on which it runs and its internet connection.

Go ahead and run the test right now on this page, and when it loads, scroll down to the bottom where the boring specs are. What’s your CPU/Memory Power score?

performance metrics

Chrome DevTools > Lighthouse > CPU/Memory Power score


Since I use a beefy PC, mine is much above average, and combined with my fairly good internet connection, I usually get a higher Lighthouse score than some of my less fortunate colleagues on spotty Wi-Fi and older laptops.

You can try this with a friend who has either a much better or much worse PC + internet situation than yourself – let both of you run the in-Chrome Lighthouse test for the same page at roughly the same time, then compare the Lighthouse score with each other’s CPU/Memory Power and internet speed. It’s very likely that the person with better technical conditions will have a much higher Lighthouse score.

We experience this every day in our work, as well-meaning clients and other agencies often send us screenshots of their Chrome Lighthouse scorecard for a website we’re working on. And the score difference can be huge. It’s not uncommon to see a 10x difference in the scores for different people. That’s a score of 8 for one person and 80 for another – on exactly the same web page!

There are many other factors at play that influence the variability of the Lighthouse score, as you may find that repeating the same test can return different results for each run.


If you have no other choice but to use Lighthouse (say, for a staging website environment) then:

  • Run it in an incognito window or as a Guest to reduce the impact of your cache and Chrome extensions.
  • Repeat the test 3 to 5 times and calculate the average and median score to compensate for the variability.
  • Do compare your page’s Lighthouse score (on the same device) with the scores for other similar pages on your or competitor websites.
  • Automate the Lighthouse testing for your development process and live website monitoring. Our example below.

It should also be mentioned that the Lighthouse scoring thresholds have been intentionally set high. The Lighthouse tool was intended to be ambitious and aspirational, nudging web developers to have more considerations for the weight and UX of their projects – not to be a benchmark or the gold standard for the entire Internet.

Also, the mobile Lighthouse audit throttles the device power and internet speed significantly. Much more so than would be the average device/network capability of real users in developed countries, creating an unrealistically low score for many websites that cater to that population.
We often see this on our projects – a website for the US, German, or Japaneese market can have a poor Lighthouse score, but stellar real-user metrics (Core Web Vitals, Google Analytics).

For all those reasons, it’s very (very) difficult to achieve a good (90+) mobile Lighthouse score on most websites. When I come across a web page with a 90+ score that also passes the Core Web Vitals I feel like I’ve just seen a golden unicorn flying through the sky, I take a screenshot and share it with my entire team.

One more thing…
The Lighthouse audits provide a list of opportunities and suggestions on what might be done to improve performance.

diagnostics summary

Lighthouse optimization suggestions


Please don’t consider this to be a simple to-do list for your developers.
Those are some basic and often general observations that apply to almost every web page out there. Telling your devs that they should “Remove unused JavaScript” or “Minimize main thread work” is like telling your car mechanic that they should fix a broken tail light (super easy) or increase the capacity of the gas tank (super difficult).

In other words, while these suggestions might be useful as a starting point, they are mostly either too obvious or incredibly difficult to execute.
The job of a web developer is to figure out what can be done to improve speed performance within the technical constraints of the particular website project and to consider all other business factors besides loading speed. Not to blindly implement some “best practice” solution from an automated tool.

To finish off this rant, I’ll just mention that we’ve recently started seeing some SEO agencies creating “website speed optimization audits” which are just those Lighthouse suggestions copied verbatim, and pasted in a branded report.

Don’t fall prey to this ugly trend and pay a premium for essentially free data.
Your web team should know how to get the Lighthouse scores from the API or various free tools like Batch Speed which includes a basic crawler, so you only need to type in your homepage or sitemap.xml to get a (single run) Lighthouse test with optimization suggestions for your entire website.

page speed metrics

Batch Speed report


There are many other (lab data) tools that incorporate the Lighthouse test or have their own audits and methods. GTmetrix, WebPageTest, or Pingdom to name a few most popular ones. As with Google’s PageSpeed Insights, all of these tools are sort of readable by laymen but are actually useful only to web developers.

If you remember only two things from this entire article, please let it be these two things:

  • Don’t use a Chrome browser Lighthouse test if you’re not a developer. Use PSI instead.
  • The Lighthouse (PageSpeed Insights) score isn’t important for SEO and Google doesn’t use it as a ranking signal!

Core Web Vitals

The only speed metrics you need to be concerned about when it comes to Google organic search are the Core Web Vitals (CWV). Since we’ve already covered the CWV in the Google “Page Experience” section above, I’ll just do a quick recap:

  • There are 3 metrics that measure the real-user experience of your website: content loading speed, responsiveness to user input, and content loading stability.
  • That data is captured only from Chrome browser users and will be counted as a ranking signal only for mobile Google search.
    [Update 2021-05-19] The update will come to Google desktop search at some point, after the mobile roll-out.
  • A web page needs to pass all the CWV score thresholds on 75% of all the times it was viewed.
    [Update 2021-05-19] Google clarified that even pages that do not pass the CWV assessment can get a ranking boost if they improve their performance, or outperform similar-quality competing pages.
  • A web page needs to pass all the CWV score thresholds on 75% of all the times it was viewed.
    [Update 2021-05-19] Google clarified that even pages that do not pass the CWV assessment can get a ranking boost if they improve their performance, or outperform similar-quality competing pages.

If you’re interested in the technical details and optimization advice, there are many great resources out there I can recommend: the official Google site, especially this recent post, and some excellent articles by Samuel Schmitt, Ahrefs, and the Smashing Magazine.

How to read the CWV scores in PageSpeed Insights

What I want to focus on here is to show you where to find your CWV scores and how to interpret them. Let’s start with what we’ve already seen, the PageSpeed Insights report.

SEO metrics

Here we have the Core Web Vitals for the IMDB mobile homepage.
The first metric is FCP, which is a “Web Vital”, but not a “Core” Web Vital (hence it doesn’t have the blue bookmark icon). We can ignore it and move on to what really matters for Google organic rankings.

Let’s look at the First Input Delay (FID) for both the page and the entire website.
FID measures the interactivity speed, how quickly did the web page process a user’s click or form input. The CWV thresholds for FID are 100 milliseconds or quicker for a “Good” score, and everything slower than 300 ms is considered “Bad” performance.

first input delay

In the PageSpeed Insights report, we’re seeing a distribution of user experiences (page views on Chrome browser) against those thresholds. So, from all the views of the IMDB homepage, 34% of the time users had a “Good” experience, 20% had an “Average” experience, while 46% of the time this page performed “Poorly”.

first input delay image

The literal number of 761 ms is not the average score, as you might expect, but is the 75th percentile. Meaning that, in the last month, 75% of visits to this page had a First Input Delay lower (better) than 761 ms.
In this case, the green bar should be at least 75% and the FID value lower than 100 ms for this page to get a passing grade.

That gives you some notion of the score distribution – if ¾ of the time your page responds much slower than the prescribed threshold of 100 ms, you’ve got some tough work ahead if you want to achieve a passing CWV score and potentially get a Google ranking boost.

percentile graph

Fortunately for IMDB, it seems that only the homepage has this issue. If we look at the Origin Summary – data for the entire website, then 86% of the time the website performs better than the “Good” threshold of 100 ms, as seen in the green part of the distribution.
Furthermore, 75% of the time it responds in less than 37 milliseconds – that’s the FID value shown here.

core web vitals summary

Find your best and worst-performing pages in the Search Console.

The easiest way to monitor Core Web Vitals for your entire website is with Google Search Console. Right on the home Overview page, you’ll see the Experience section, showing you how many of your pages pass all the Page Experience tests, and separately how many pages pass or fail the Core Web Vitals and the Mobile Friendliness Test.

page experience metrics

Google Search Console – Experience Overview


Only the pages that pass all criteria can have a “good experience” and may be awarded in the Google search results.

page experience metrics

Distribution of pages on a website with good page experience


The sub-optimal pages are grouped by the CWV metric that they fail, so that you (or your dev team) can focus the optimization efforts on resolving the issue on multiple pages at once.

A single page is scored by its worst metric. If two CWV values are “Good” but one is “Poor”, the web page will be considered to have a bad user experience, and placed in the “Poor” bucket.

page perfprmance

Google Search Console – Core Web Vitals overview


The only shortcomings of the Search Console reports are that you don’t have CWV data for every URL – the only place to see that is by checking the PageSpeed Insights for a particular page (manually or automated with the API).

And also, in the Performance report, you can now isolate the pages with Poor performance, but you cannot compare them with the Good ones (or total average) directly in the Search Console interface. Annoyingly, you have to export the data and use some other visualization tool to achieve that.

Analyze performance over time, for your site and competitors

The third method of finding your, or any other website’s Core Web Vitals is to use the CrUX report – the database where all Web Vitals from all users and websites are stored and made public by Google.

If you’re handy with SQL, you can tap into the (still aggregated) data directly from BigQuery.

For everyone else, there’s the handy Google Data Studio dashboard.

The instructions state that you should create a new dashboard for each website, but that seems highly impractical and off-putting to anyone who hasn’t worked with Data Studio before. Fortunately, since the data set already has the origin parameter, I’ve quickly created an input field where you can type in or paste any origin you wish, and the dashboard will automatically pull in all the data.

I’m surely not the first person to do that, but I haven’t found it mentioned or linked anywhere, so I created my own.

Here’s the one-for-all CrUX dashboard which I’ve made publicly available.

core web vitals

CrUX dashboard with input field


Be careful that you enter a valid website origin with the correct protocol (http or https), subdomain (www or something else, can be without), and ending with the top-level domain (.com, co.uk, .org).

If the dashboard doesn’t work, it’s probably a typo or an invalid origin.
Btw, the only thing that doesn’t matter is the trailing slash at the end of the origin URL, with or without will work.

Also, be mindful of subdomains like mobile versions of the website. As with the mobile IMDB example, you will get completely different results because the two versions are treated as separate website origins.

core web vitals

You can select multiple months of data to see performance fluctuations over time, so have fun exploring your website, or any other for that matter. The CrUX data set is huge and has real-user data for most websites with enough traffic volume.

LCP graph

CrUX dashboard – monthly metric changes

Get ready to speed up your website in 4 steps

Ever since Google first announced the Page Experience update, we at CMG have been steadily preparing for the expected increase of website speed optimization requests from our clients. We started with a vision of the future, devised a strategy and an execution plan, then focused on people, knowledge, and toolset.

Ever since Google first announced the Page Experience update, we at CMG have been steadily preparing for the expected increase of website speed optimization requests from our clients. We started with a vision of the future, devised a strategy and an execution plan, then focused on people, knowledge, and toolset.

1. Create a dedicated team (and have mercy upon them)

You might have noticed that in this fairly long article I never gave a single suggestion or tip on how to actually improve the speed of your website.
That’s because speed optimization is exclusively in the domain of website development. With myself being just a web analyst and an SEO, I can only contribute to the optimization efforts by understanding Google’s requirements and implementing the appropriate measurement methods.

The first thing any web-based company or digital agency should do is to create a dedicated team of people who are responsible for gathering knowledge and executing all performance optimization tasks.

While in the past it was expected of each developer to understand the basics of page loading speed and optimization tactics, with the introduction of new metrics and the rise of website speed importance, this was no longer feasible nor fair to expect from everyone. There is simply too much new information to digest, tools to learn, and optimization approaches to test out on each tech stack.

At CMG, we formed a cross-department group of experts that includes backend and frontend developers, automation and database programmers, UX designers, SEOs, and web analysts. This has already proven to be an excellent mix, since we can complement each other’s skills, easily share knowledge (both wins and fails), build internal tools, and most importantly, actually improve the speed performance of our websites in a sustainable and measurable way.

This is how optimization in progress looks like:


SEO graph

If you have just a small team of web developers, at least give one of them the misfort… opportunity to become the go-to person for speed performance measurement and optimization.

And for any managers reading this – please be aware that these new Google site speed requirements arrived kind of suddenly. With developers already having a full plate of work and a pantry-sized backlog, learning new metrics, tools and skills requires additional time that many of them simply do not have. So, be kind to your dev team and ensure that they have enough time and resources to improve their performance optimization game.
Because the teams that do, are about to become much more valuable

2. Educate from the inside out

The second most important thing after getting a team together and declaring who is responsible for what, is to work on gaining knowledge and expertise about website speed improvements.

Naturally, the people in the “SpeedOps” team need to learn everything they can, specializing in areas where they can be most helpful to the group. Everyone needs to understand the basics of speed metrics and Google’s tools like Lighthouse and the Core Web Vitals. But, then people in the team should branch out to explore their specific skill paths.

Developers will focus on learning optimization tactics and tricks for the backend and frontend platforms that they use, while the automation team dives into the various APIs to figure out the best way of doing on-demand or scheduled website performance tracking.

SEOs and analysts might have a leading role here, as they’re usually the ones responsible for all things related to Google, website traffic, and organic search performance. And, they’re also the ones most closely following the industry news.

Then we have the UX, web designers, and QA team representatives – just to make sure that the rest of us don’t break the website by trying to make it faster.

Once the core team has essentially self-onboarded and gained enough knowledge and confidence, it’s time to educate the rest of the company, starting with account and project managers. They need to know the business-oriented side of website speed optimization and be sufficiently informed about it so they can continue the education process towards the clients.

If you need more resources to start learning about website speed and its impact on SEO, I recommend that everyone first watches this video of Google’s John Mueller explaining the basic concepts. Also, this is a great article from Speed Curve aimed at product managers.

Specifically for developers, here are some helpful starting articles from Google, Ahrefs, and Samuel Schmitt.

And for those of you who don’t have any web development experience but really need to understand what exactly are the devs doing to improve your website – this is the only video I can suggest.

3. Automate synthetic speed measurement

As we already know, the Lighthouse test is the most practical way to measure speed performance on password-protected and non-public websites. Our developers use it often and on all projects.

However, Lighthouse has several shortcomings:

  • The most commonly used Chrome browser version is for manual tests only.
  • The test is run once, for a single web page, and on a single device.
  • It doesn’t accurately represent the real-user experience (try as it might).
  • It doesn’t store test data for historical comparison.
  • The resulting scores have a frustratingly high degree of variance.

To remedy these problems, we’ve first started using the Lighthouse API to run the scheduled tests from our server, collect the results in a database, and create dynamic visualizations in Google Data Studio.

lighthouse metrics

This was immediately useful as we could finally see accurate data.
The many tests performed had solved the problem of score variability, since we could calculate the average or median score from a representative sample of Lighthouse runs. And everyone in the team was excited by the ability to see day-by-day or even hourly progress on their projects. We even started tracking pages from our live websites, just to have a more granular and timeline-based view of their performance.

While developers can use a detailed report on an hourly/daily basis for the website they’re currently working on, project managers just need to keep an eye on performance for their brands

score distribution by brand

The only issue was that the average scores we got from running Lighthouse on our server often didn’t match with the Lighthouse score seen in the PageSpeed Insights report. This created another moment of confusion and misunderstanding between our teams, clients, and other agencies – everyone was working with different tools and seeing different results, even though we were all using the same metrics.

The only issue was that the average scores we got from running Lighthouse on our server often didn’t match with the Lighthouse score seen in the PageSpeed Insights report. This created another moment of confusion and misunderstanding between our teams, clients, and other agencies – everyone was working with different tools and seeing different results, even though we were all using the same metrics.

Thankfully, there’s also a separate PageSpeed Insights API that runs the Lighthouse test on Google’s servers. We tried it out and the daily average for any tested web page closely matches the average of 5 PSI runs. Phew!


average scores for selections

The next thing on our to-do list is to try the Lighthouse CI so that our devs can get the speed metrics much earlier in the project, and start performance optimization at the beginning of the website build.

Weekly and monthly trends are essential for spotting unexpected changes:

weekly changes

4. Make your own RUM

While automating the Lighthouse test gives us a good estimate on how a website might perform, The real-life experience of people visiting a production website can be very different. To capture the website speed performance that our visitors experience, we needed to implement some sort of Real User Monitoring (RUM).

The Core Web Vitals only capture the unknown number of Chrome users, the breakdown by page is impractical to get and not possible for all websites (if traffic is too low), and most importantly – it is completely disconnected from the website’s business objectives, like user engagement and other metrics we track in Google Analytics.

Now, some of you may say: But wait, don’t we have the Page Load Time and other related metrics already in Google Analytics?!

google analytics page loading speed

Part of our internal dashboards for weekly website monitoring with GA data


True. However, most people don’t realize that page speed metrics in GA are heavily sampled.

They are recorded for the maximum of 10% of all pageviews, and this can drop to 1% on high-traffic websites. You can’t see it in any of the standard reports, but if you create a custom GA report, you can find the metric named “Speed Metrics Sample” which will be at about 10% or less as the Pageviews count for each Page. That is just too little data for any reliable analysis.

SEO results

The solution we’re now testing is to use the Core Web Vitals API. We can deploy it with Google Tag Manager either as a Custom HTML tag (as instructed by our friends at Tag Manager Italia) or with a custom template made by the patron saint of GTM, Simo Ahava.


SEO graph

We can see if each page passes the CWV assessment. There’s not much data on this testing account, but you get the idea.

lcp graph

Deep dive into distribution for each CWV metric


The idea is to track the 3 Core Web Vitals metrics for all users that visit our website and get the most accurate representation of the page loading experience. With this data in hand, we can not only track the page loading speed with greater accuracy (or do fancy visualizations in R) but also connect and correlate those metrics with other data points in Google Analytics.

graph unique page loads

Correlating LCP with Avg. Time on Page – no correlation so far, we’ll see in a few weeks if that changes.


For instance, we can see if users from certain locations or using specific browsers have a worse on-page experience than others. If so, we can instruct our developers to test and optimize the website so it performs better for those users.

Or, even more exciting, we can see how page speed experience affects user engagement metrics like Bounce Rate, Scroll Depth, Avg. Time on Page and Click-Through Rate for conversion pages.

SEO chart

Once we gather more data, we expect to see the Bounce Rate clearly rise with longer LCP.

pageviews table

Comparing browser performance might be useful to developers working on site optimization


Alongside this new toolset, don’t forget to implement existing time-tracking methods for sending GA custom events or timing hits for crucial user interactions – like adding items to the shopping cart or using some other resource-heavy feature of the website.

Being able to unearth and visualize any delays that users experience on your website can be a transformative experience for the entire team, and fixing those issues can greatly help to reduce purchase abandonment on eCommerce sites.

And that’s a wrap!

You’ve made it all the way to the end of this quite lengthy article, and for that, you have both my thanks and my admiration.

I’ll be sure to follow up with any new developments or Google announcements as they come along. Also, if you noticed any errors or incorrect information, please do let me know via Twitter or LinkedIn, I’m adamant to keep this article up to date and factually correct.